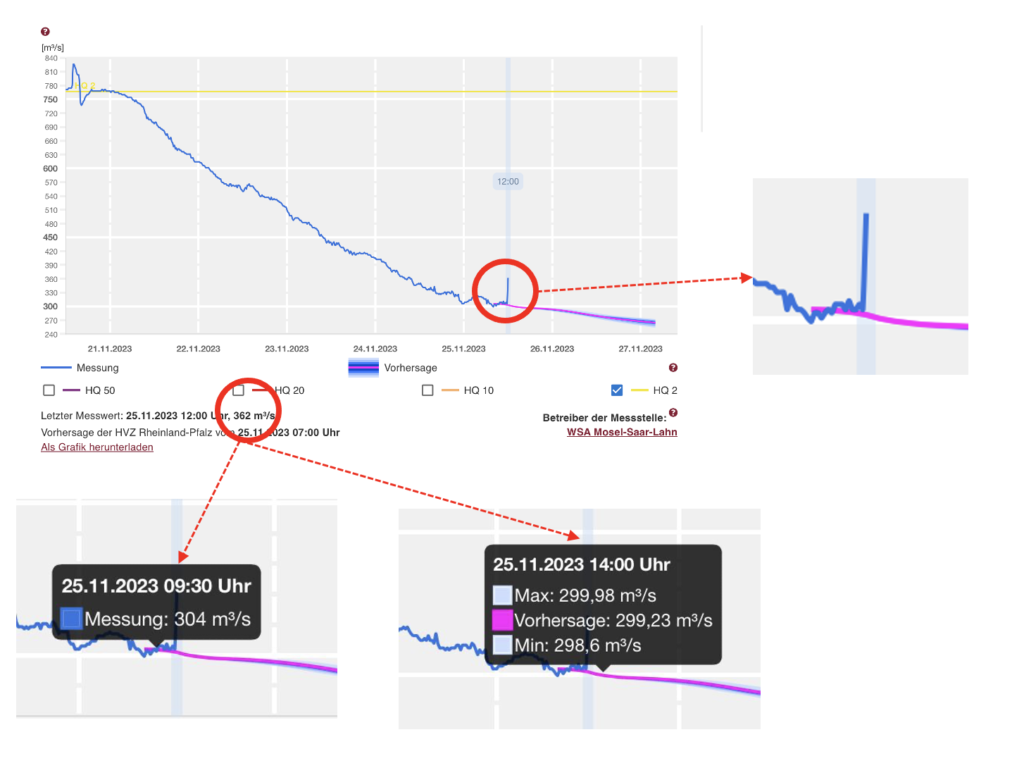
I have noticed that the chart and text related to the flow in m3/s of current on the Moselle River in Perl shows consistently a peak / spike in the last measurement. That spike smooths then at the following refresh.
Also, by hovering the mouse over the previous values as well as on the immediate forecast for the next hour, the flow shows a significantly lower value.
Based on this observation, I presume that the last measured value is incorrect, and that to get a reliable value it is necessary to get a value on the chart measured a few minutes below the last value.
In the example below, the last value is shown to be 363 m3/s but the value a few minutes before was 304 m3/s and the forecast for a few minutes later is 299,23 m3/s, that makes unlikely that the 363 m3/s value is a correct one.


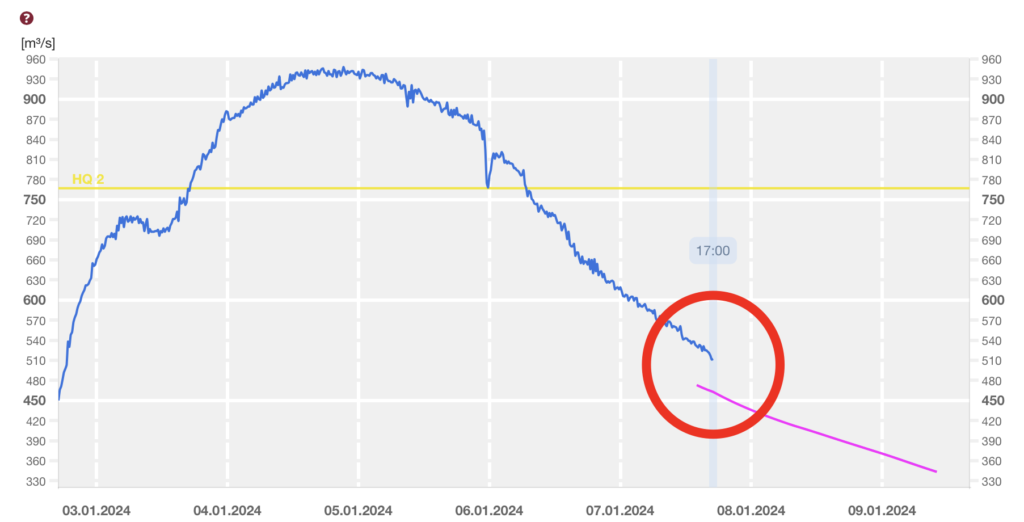
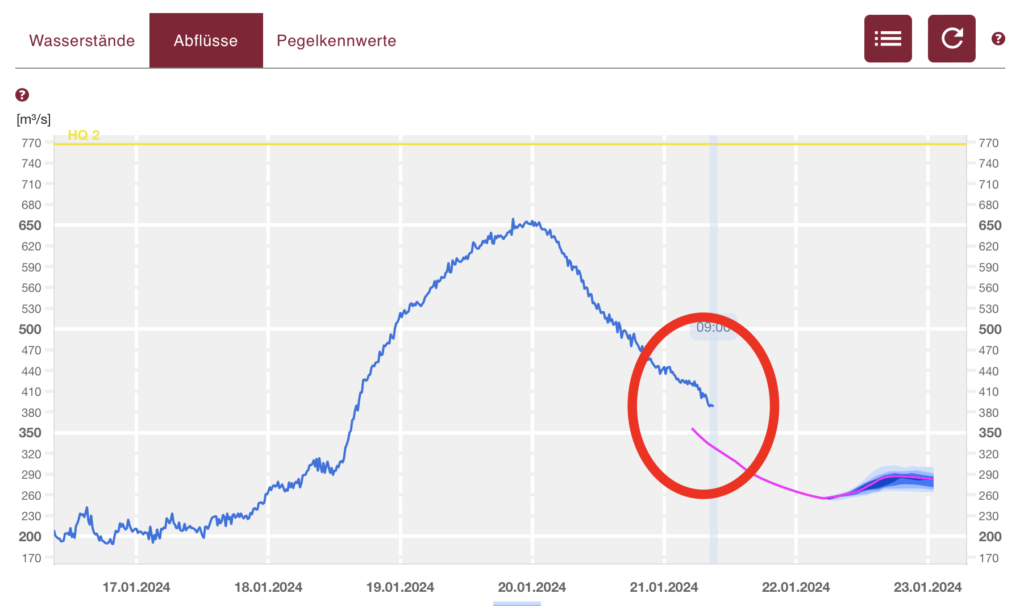
Other example in 2024 – dfferent pattern but still inconsistent


Leave a Reply