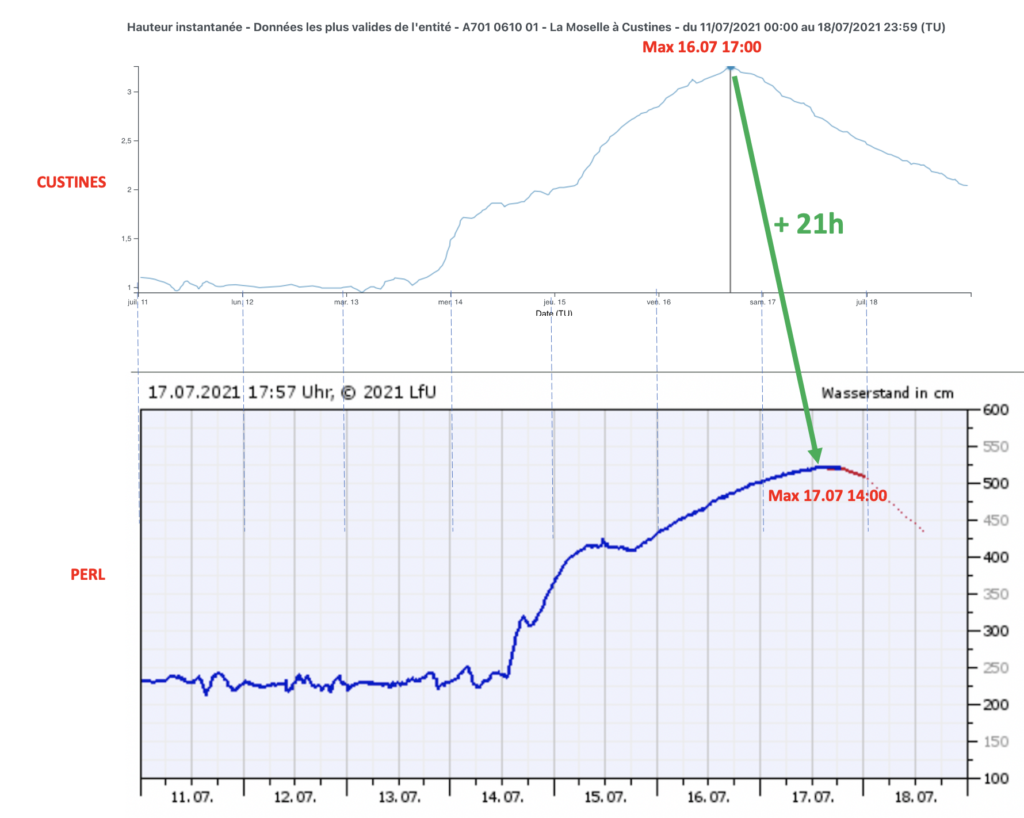
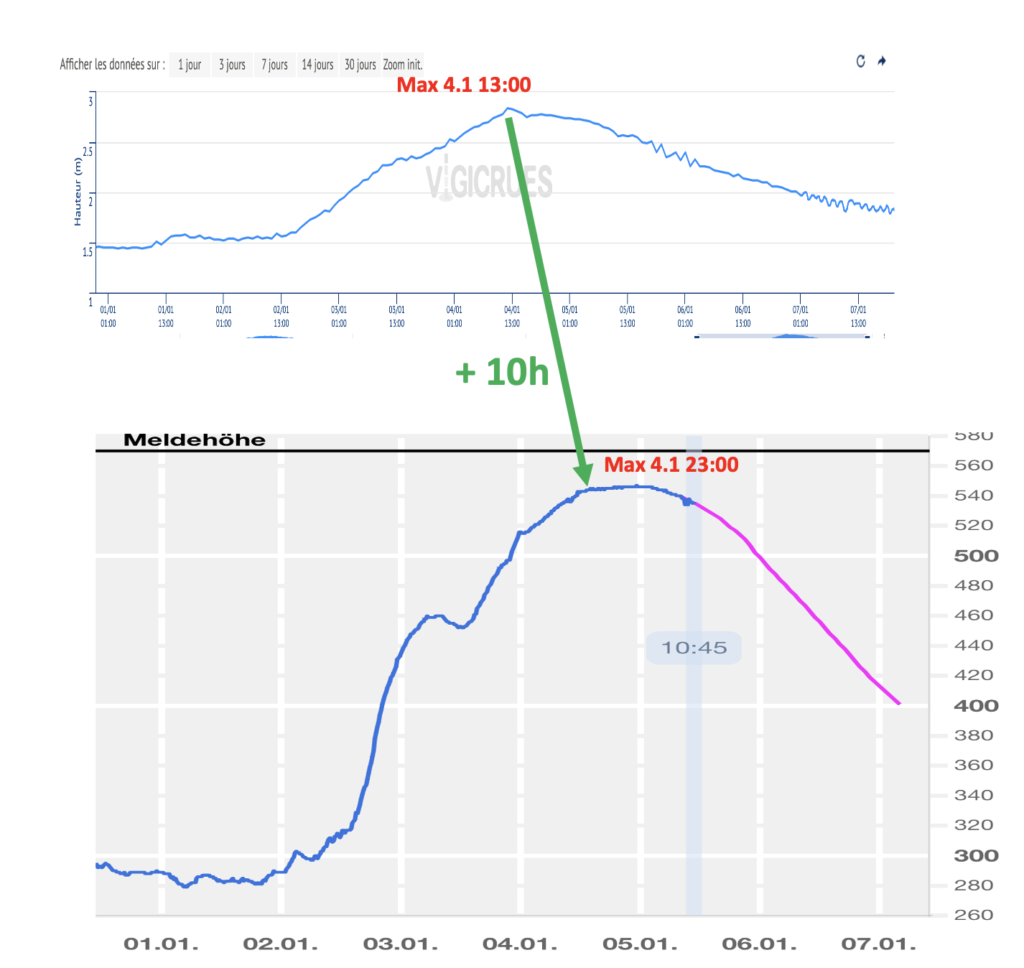
This is an initial analysis of the evolution of the water level in Custines, F (km 343,6) and in Perl, D (km 242,0) to determine if there is a pattern that can be used to predict the level of water in Perl based on the level in Custines (about 100 km downstream).
The current analysis shows significant inconsistencies in
- delay on level peaks – ranging from a minimum of 10 to 21 hours
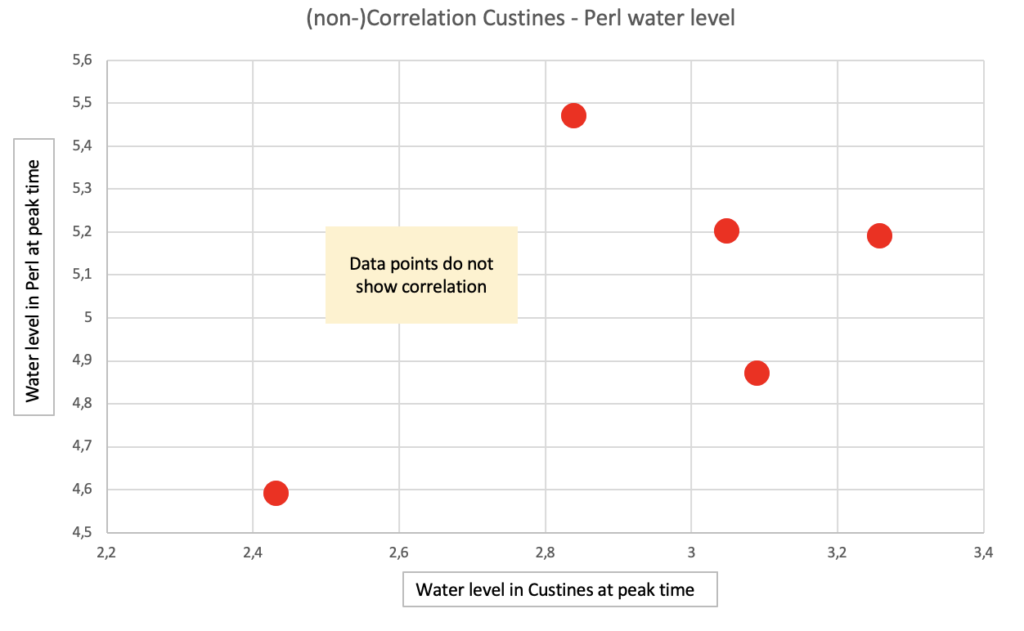
- correlation of level:
- a max level of 3,26 m in Custines corresponded to 5,19 m in Perl
- a max level of 5,47 m in Perl was only 2,84 m in Custines
The inconsistencies might be caused by different tributaries as well as difference in weather conditions in different areas, an also by the settings of the water locks.
The suggested conclusion is that the water peak time and peak level at Custines cannot be used to predict water peak time and level in Perl.
| Significant level Custines | Significant level Perl | Delta time | Level ratio |
| Max 16.07.2021 17:00 3,259 m | Max 16.11.2023 14:00 5,19 m | 21 h | 1,59 |
| Max 15.11.2023 16:50 3,091 m | Max 16.11.2023 11:50 4,87 m | 19 h | 1,58 |
| restart 17.11.2023 1:40 2,433 m | restart 17.11.2023 16:00 4,59 m | 14 h | 1,89 |
| Max 18.11.2023 13:15 3,049m | Max 19.11.2023 8:15 5,20 m | 19 h | 1,71 |
| Max 4.1.2024 13:00 2,84 m | Max 4.1.24 23.00 5,47 m | 10 h | 1,92 |
(non-)Correlation of level peak time


(non-)Correlation of peak levels

Leave a Reply